

THE CAF STANDARD
SETTING THE STANDARD FOR CLEAN AIR
CAF doesn’t just meet industry standards—we help set them. By collaborating with organizations like CalEPA, CAF plays an active role in shaping the filtration benchmarks that protect workers and indoor environments. Every CAF system is spot-tested at multiple stages of production to ensure superior performance.
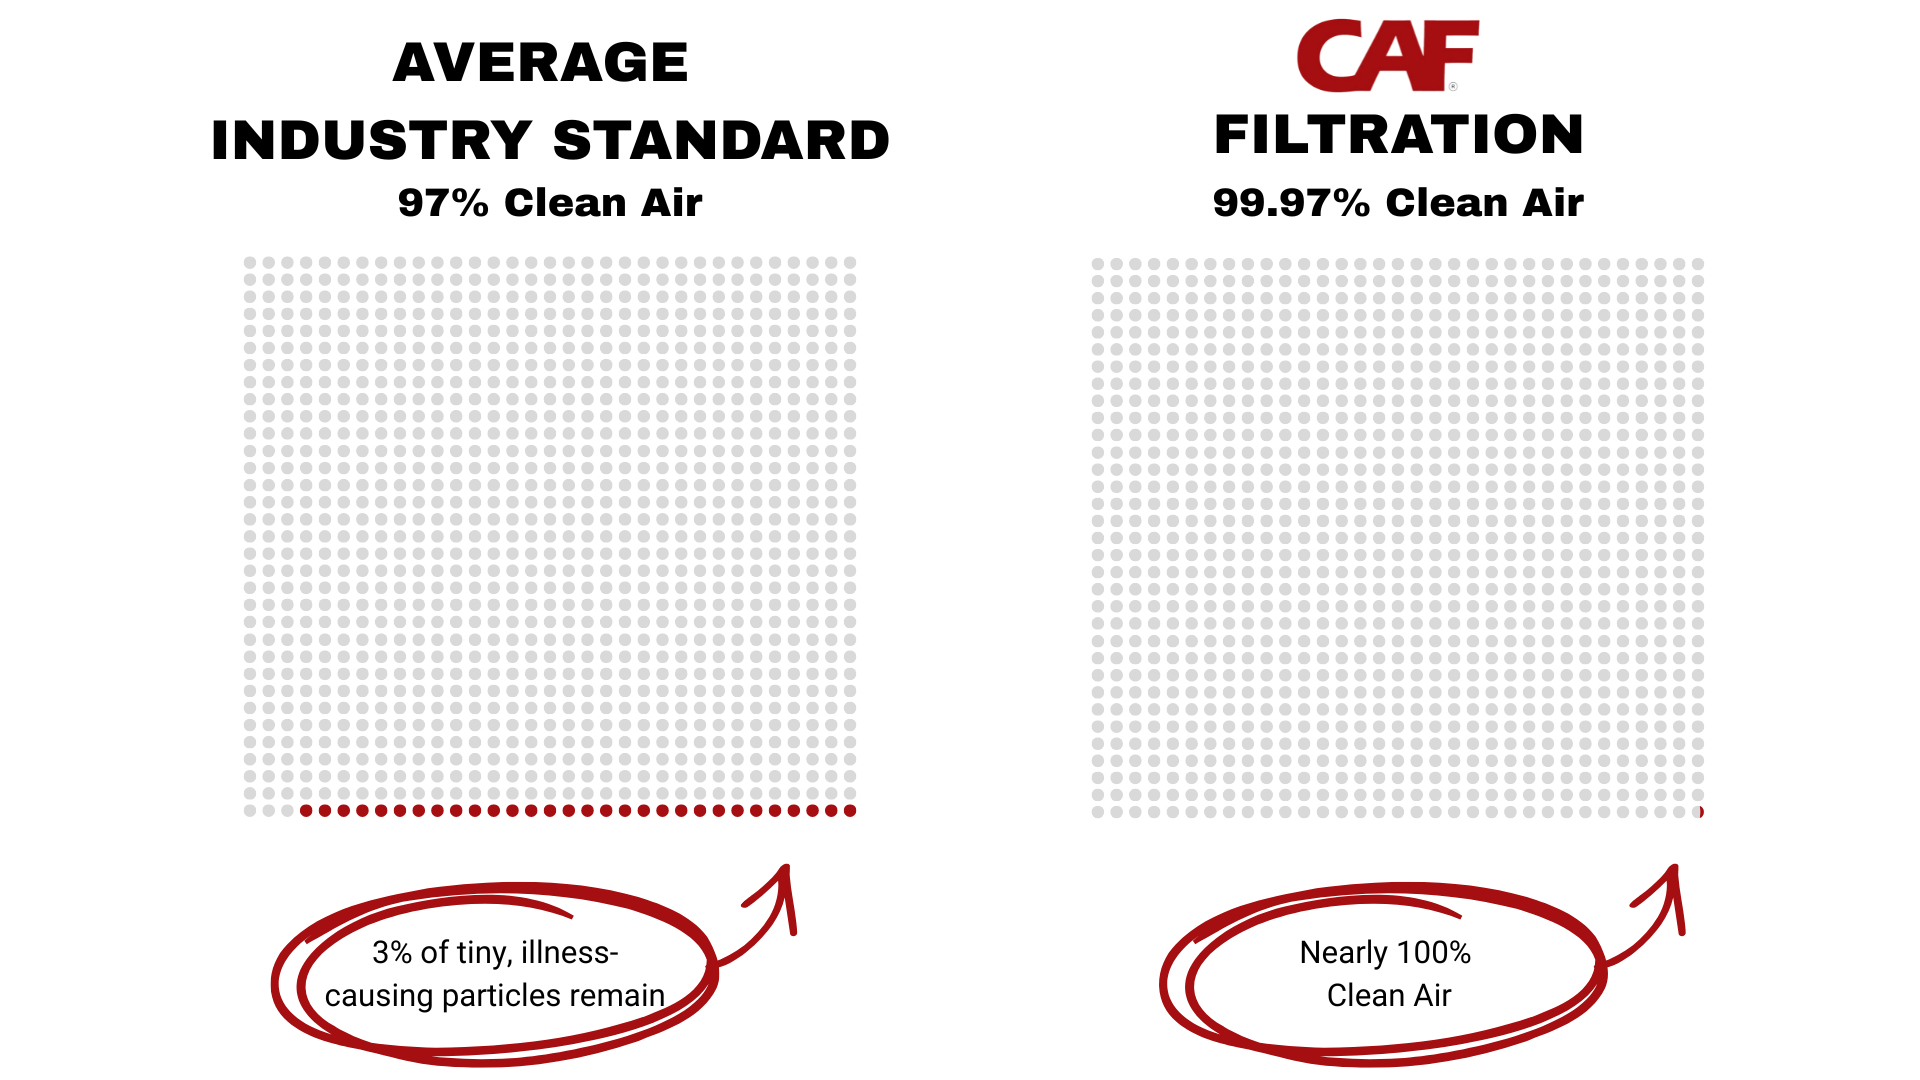
Average industry-standard filters remove 97% of airborne particles. That remaining 3% are the smallest, lightest, and most dangerous—microscopic contaminants capable of reaching deep into the lungs and even entering the bloodstream.
CAF filters remove 99.97%, capturing nearly every particle that others leave behind, keeping the air around you cleaner, safer, and measurable.
How We Exceed Standards:
Patented Cab Integrity Test ensures consistent protection.
Operator Protection Level testing for particulate and vapor efficiency.
Advanced laboratory and field testing to correlate real-world performance.
Ongoing quality control for every component and finished product.

WHY AIR QUALITY MATTERS
Within a 5-foot radius of you, there are roughly…
1,000,000,000 airborne particles
…and the smallest ones are the most dangerous. Here’s what’s commonly in the air around us:
Dust & fine particulate matter

Allergens (pollen, pet dander)
Mold spores
Volatile organic compounds (VOCs)
Agricultural/industrial particulates

Smoke & combustion particles
WE DON’T SETTLE FOR ‘GOOD ENOUGH’
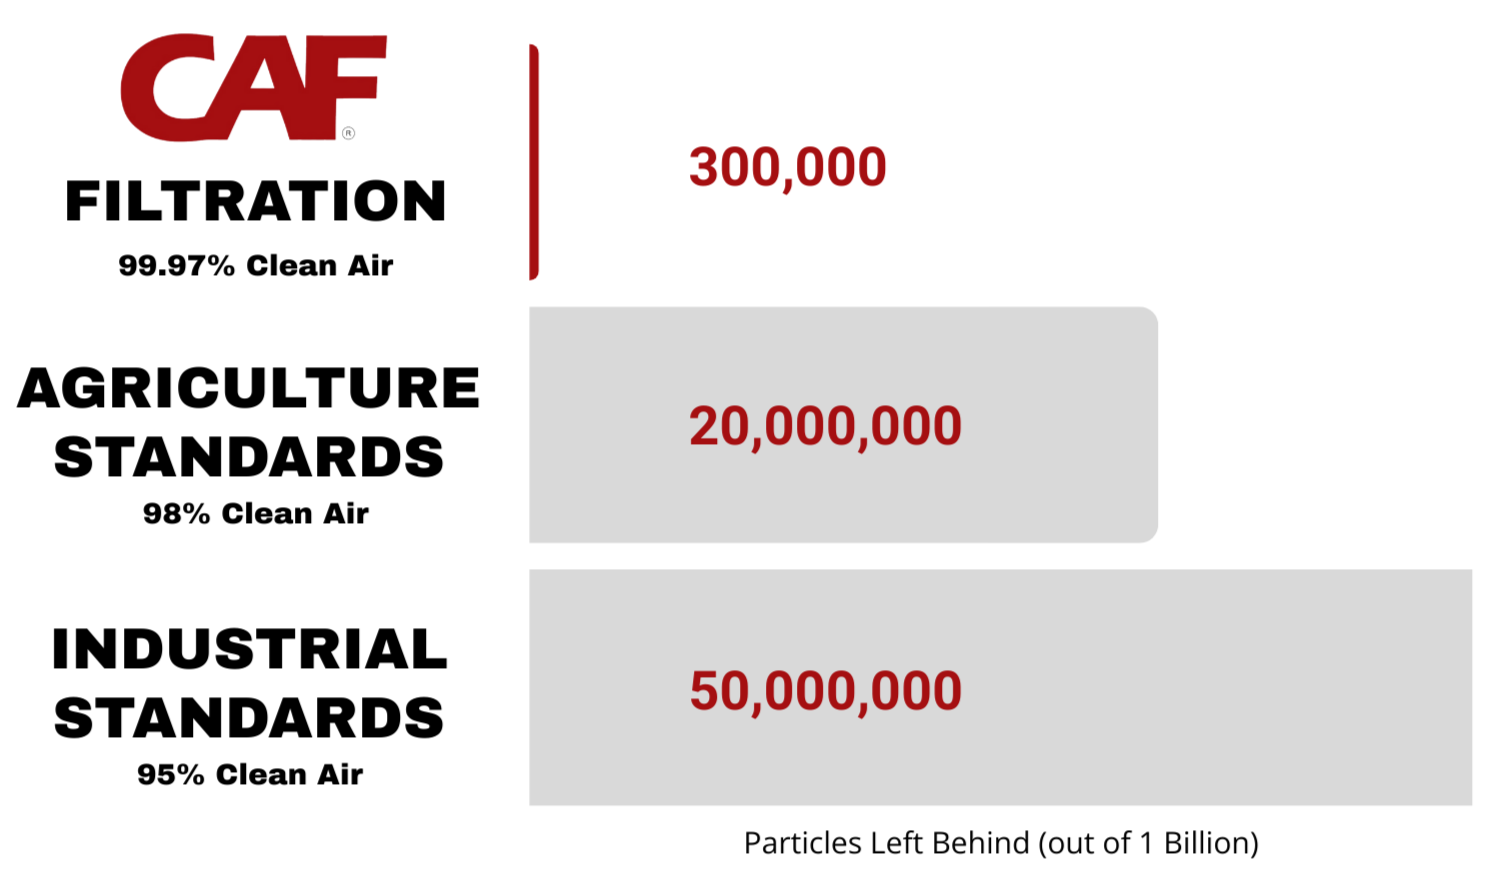
The difference between industry standards and CAF seems small… until you put it on this scale.
Most filters only meet agriculture standards at 98% or industrial standards at 95%, which might sound high—until you consider 1 billion particles floating within 5 feet of you. At 98%, 20 million particles remain. At 95%, 50 million particles remain.
CAF’s 99.97% filtration slashes that number to just 300,000 particles, capturing the tiny, harmful particles that can reach your lungs and bloodstream.
The result: cleaner air, safer spaces, and protection you can actually measure.
RESEARCH & DEVELOPMENT


INNOVATION DRIVEN BY RESEARCH
Particulate and vapor filtration with advanced organic vapor adsorption.

Operator Protection Level parameters @ 0.3µm to ensure clean airflow.
Fit Factor and Protection Factor methodologies to optimize cab performance.
Real-world field testing correlated with lab data to maximize efficiency.